
Qonnections 2016
Elevate Your Maps + Apps With Analytics8
Where You'll Find Us At Qonnections
Our squad will be at the Analytics8 + QlikMaps booth #401 throughout the conference and presenting at sessions. We'd love to talk to you more about elevating your apps + maps so you can find ways to make smarter business decisions using your data.
-
QlikMaps Technical Session>> Decision-Based Location Analytics: Develop Maps That Provide Maximum Business Value
WEDNESDAY, MAY 4 | 10:30 - 11:30am
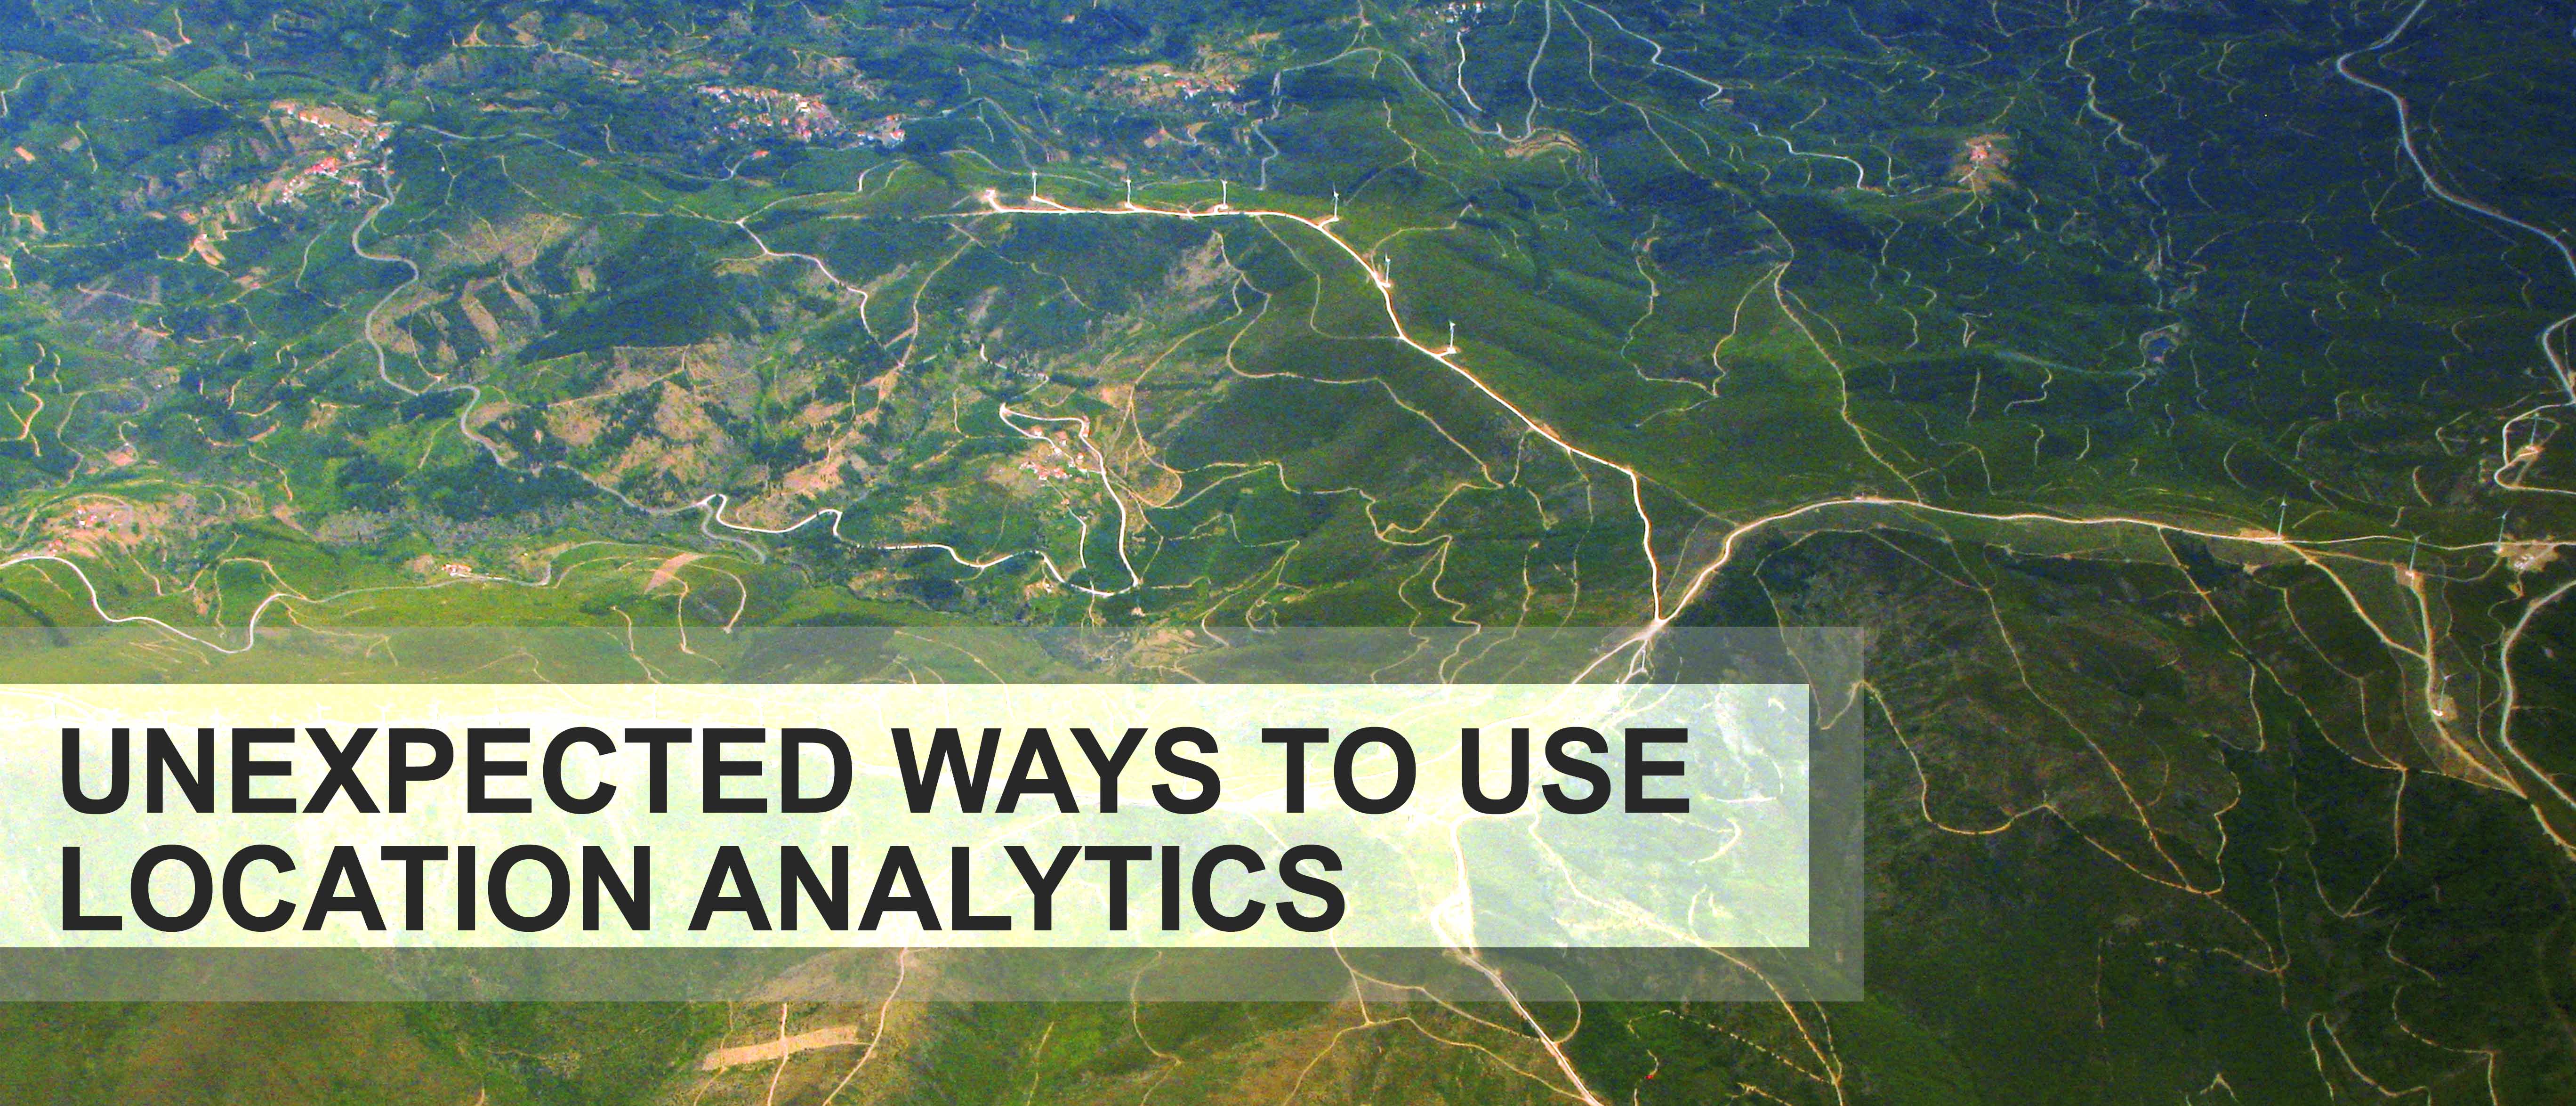
The addition of maps and geographic context to your Qlik apps allows you to make discoveries that graphs, charts, and other visualizations can’t reveal. A map becomes your new analytical tool that unlocks the hidden value of location in your business data.We will share 5 tips from our location analytics experts that you should instantly implement to ensure your maps provide data-driven answers to your business questions.
-
QlikMaps Business Session>> Where To Next?Transition From Maps to Strategic Location Analytics
TUESDAY, MAY 3 | 4 - 5pm
When it comes to mapping your data, are you able to answer business questions and take action or are you just looking at your data on a map?
We’ll briefly show you how to maximize Qlik’s out-of-the-box mapping capabilities to get you started with simple mapping concepts. Then we’ll spend the majority of the time showing you how to enhance your location analytics strategy by extending Qlik’s functionality with rich mapping visualizations from QlikMaps. -
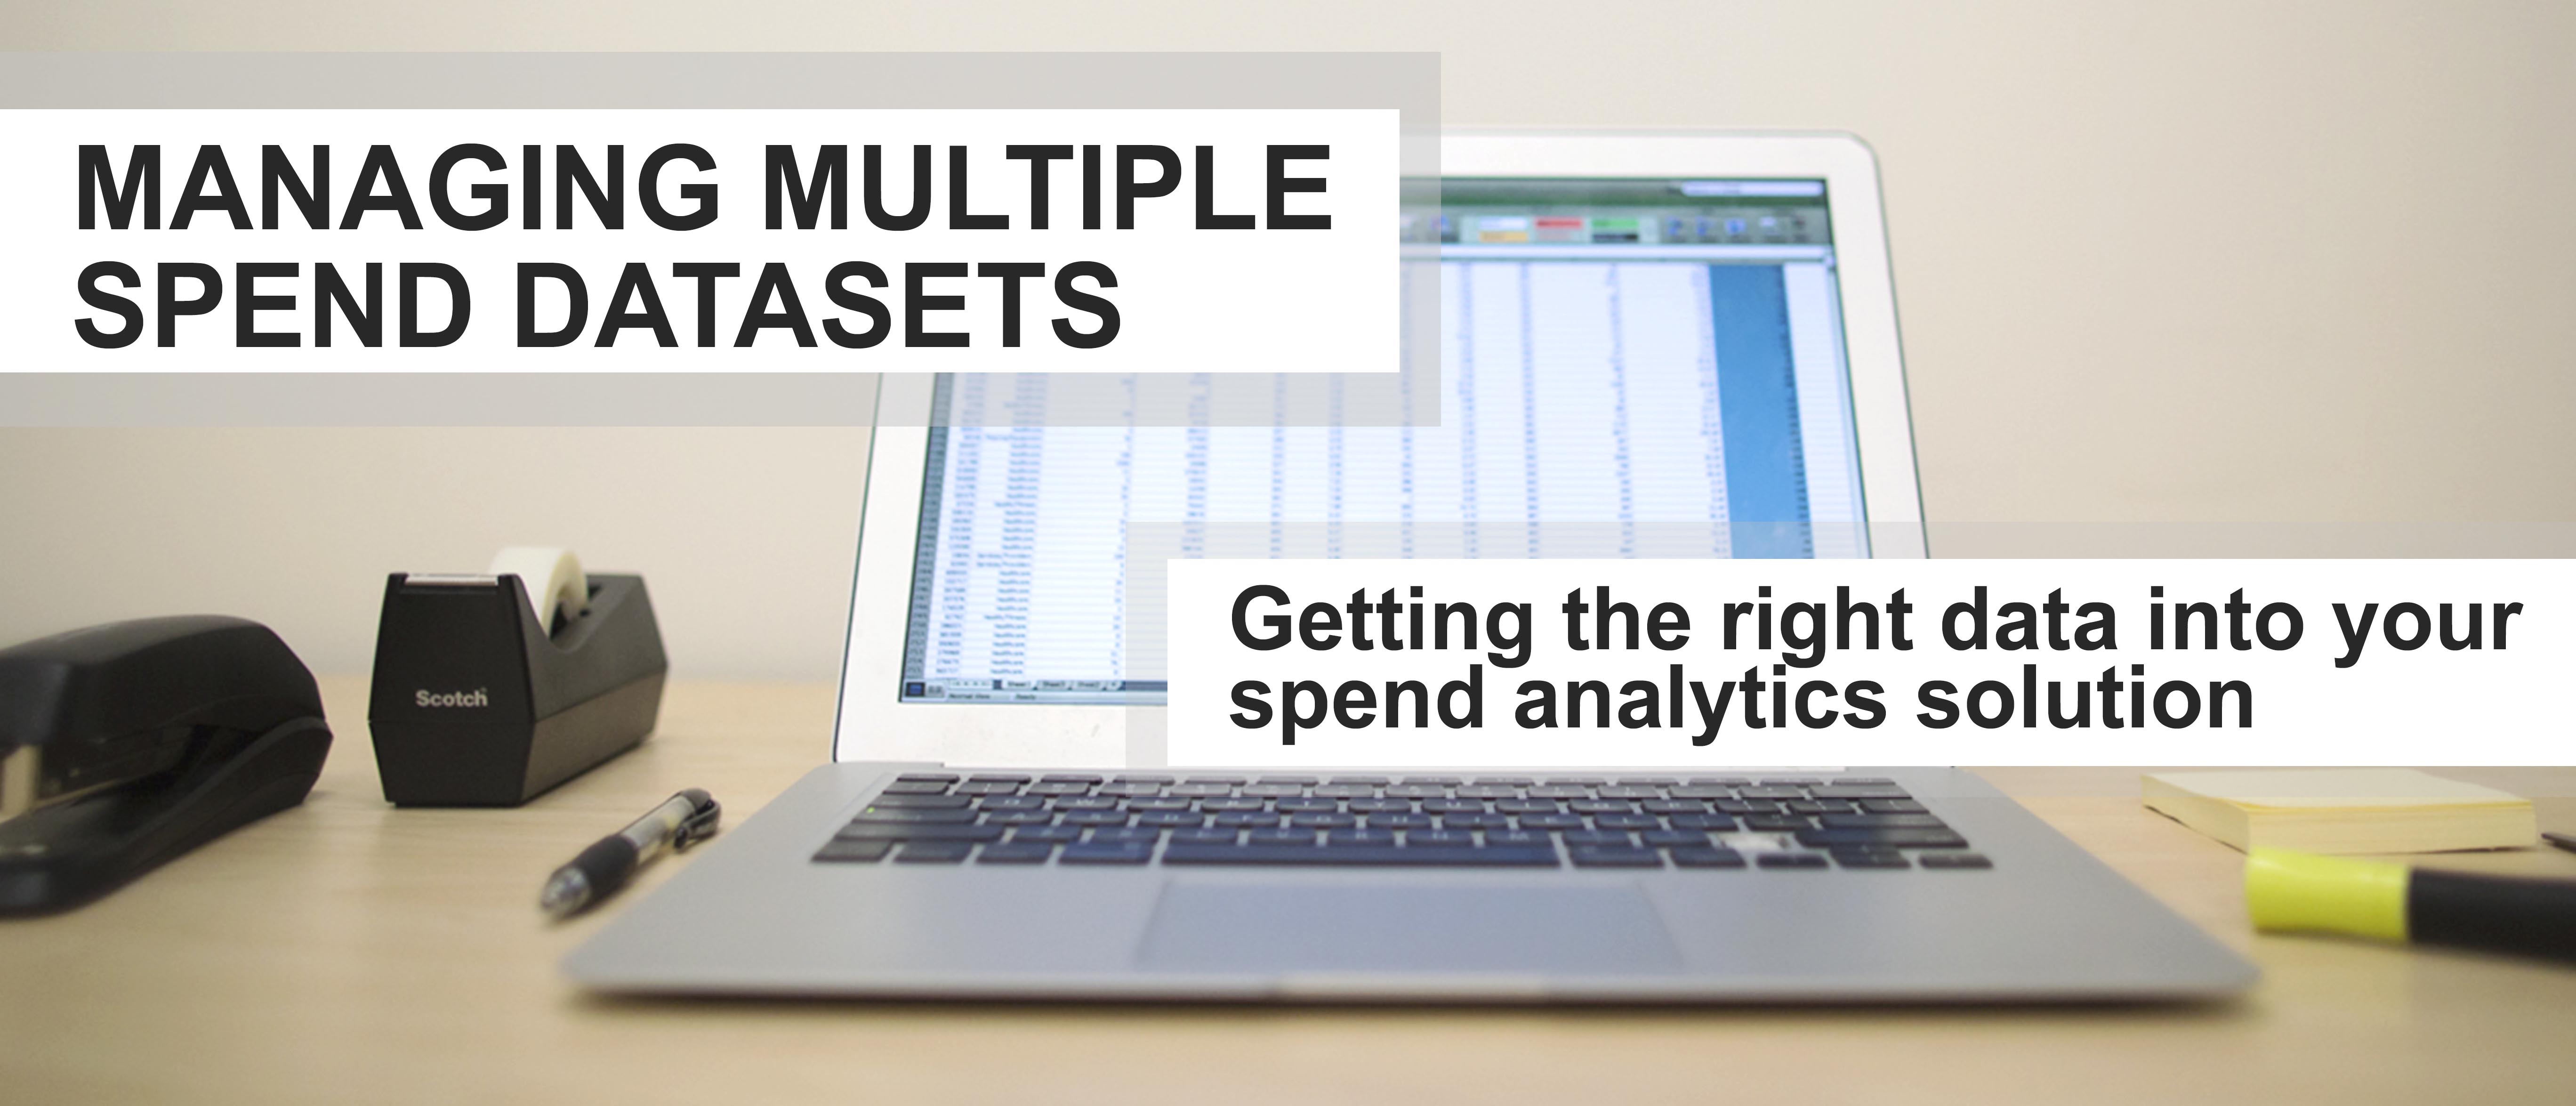
SpendView Session >> Delivering Full Visibility Across Your Spend
TUESDAY, MAY 3 | 11am - 12pm
See how you can take control of your spend, make better purchasing decisions, and identify savings opportunities that directly impact the bottom line. In this session we will show you SpendView- a comprehensive Spend Analytics solution that consolidates, cleanses, and classifies all spend-related data in one place, giving organizations full visibility across all of their spend. -
Abbvie Customer Session >> Less Paper, More Data
TUESDAY, MAY 3 | 3pm - 4pm
One of our customers, Abbvie will be presenting and asked us to join them. This session provides an overview of utilizing Qlik Sense to replace a semi-annual reporting process that delivered executive level reporting as well as more granular level reporting . Moving to Qlik Sense provided an interactive dashboard and greater access to data.
QlikMaps
DEMOS AT BOOTH >>
UniverseBridge
Tuesday, May 3 @ 12:30pm
Wednesday, May 4 @ 5:30pm
SpendView
Get full visibility across all of your spend with this spend analysis tool.
DEMOS AT BOOTH >>
Tuesday, May 3 @ 1:30am
Wednesday, May 4 @ 10:00am
SESSIONS >>
Tuesday, May 3 @ 11am
Training
Equip your team with Qlik training so you all can be Data Ninjas.
Analytics8
-
Take a brief survey about BI and how you use Qlik and we'll give you one of our exclusive Data Ninja t-shirts made specially for Qonnections. Take the survey at our booth or take the survey on your own time and show us the screen shot of the confirmation page to get your shirt.
We'll publish the results after Qonnections, so keep an eye out for some of the trends that show up with Qlik users.
Resources To Help You Succeed
-
[ WEBINAR ] Best Practices For Developing Maps To Provide Maximum Business Value
-
[ WORKSHEET ] How To FIND THE RIGHT LOCATION ANALYTICS TOOLUnlock the hidden value of location analytics. As you're looking for a solution, there are 4 questions you need to answer with your team first and then 14 specifications to compare and contrast between tools.
-
[ EVENTS ] opportunities to learn about mapping & BI best practices
-
[ BLOGS ] Data strategies, analytics tips, BI best practices, industry insights, and all the resources you need to be a #DataNinja.
-
Subscribe To Get More Resources Delivered Directly To Your Inbox